

Margin Velocity Economics (MVE)
What is Margin Velocity Economics?
Two brands can post identical revenue growth in the same year and tell completely different stories about whether that growth is structurally healthy. Margin Velocity Economics (MVE) separates them.
MVE is an analytical framework that decomposes the change in Sales and Marketing Contribution dollars from one period to the next across six interpretable drivers. The output is a clear read of which dynamics are funding growth, which are consuming it, and where the structural commercial decisions need to be made.
The framework focuses on contribution margin — specifically, what I call Sales and Marketing Contribution: revenue minus the direct, appropriately allocated, fixed costs of selling and marketing each brand and brand-pack across every route-to-market, channel, and geography in which it competes. These costs include broker fees, trade spend, outbound logistics, field sales overhead, shopper marketing, retail media, digital and social marketing, and direct marketing investment. Conventional P&L structures routinely sit these costs in operating overhead rather than allocating them to the brand, the channel, or the brand-pack that incurred them.
MVE makes these dynamics visible at the level of granularity where commercial decisions are made — by brand, by brand-pack, by channel, by retailer, by route-to-market, by geography.
The six Sales and Marketing Contribution drivers
The change in contribution dollars from one period to the next can be fully attributed to changes across six drivers and the new brand-pack contribution introduced in the period.

The volume side carries two drivers — measuring rate-of-purchase and reach. The price side carries two drivers — measuring gross price effect and the trade investment that takes the brand from gross to net. The cost side carries two drivers — measuring unit cost movement and direct selling expense discipline.
Together, the two price-side drivers complete the gross-to-net pricing decomposition. Price-Pack Integrity isolates the gross price effect — what the brand owner invoices. Trade Marketing Effectiveness isolates the deduction effect — what the brand gives back to support volume. The two sum to the net price impact on Sales and Marketing Contribution, which is why MVE separates them rather than collapsing them into a single net pricing line.
The six drivers do not work in isolation. Every market decision and every external dynamic that influences one driver typically influences another. MVE makes both the relative impact of each driver and the totality of those impacts visible in dollar terms.
The two lenses
MVE uses two lenses to deconstruct the volume side. The Velocity–Distribution lens reads volume change as Velocity Momentum and Distribution Expansion. The Loyalty–Penetration lens reads the same volume change as Loyalty Deepening and Penetration Widening. Both lenses aggregate up to the same total volume effect, but the performance and insight dynamics each reveals are different.
The right lens to use depends on the syndicated, first-party, and brand data available — and on the commercial question being asked. The Velocity–Distribution lens is the right read when the diagnostic question concerns retail execution, channel expansion, or whether new doors are earning their economics. The Loyalty–Penetration lens is the right read when the question concerns who is buying the brand, how often, and whether the consumer base is widening or deepening.
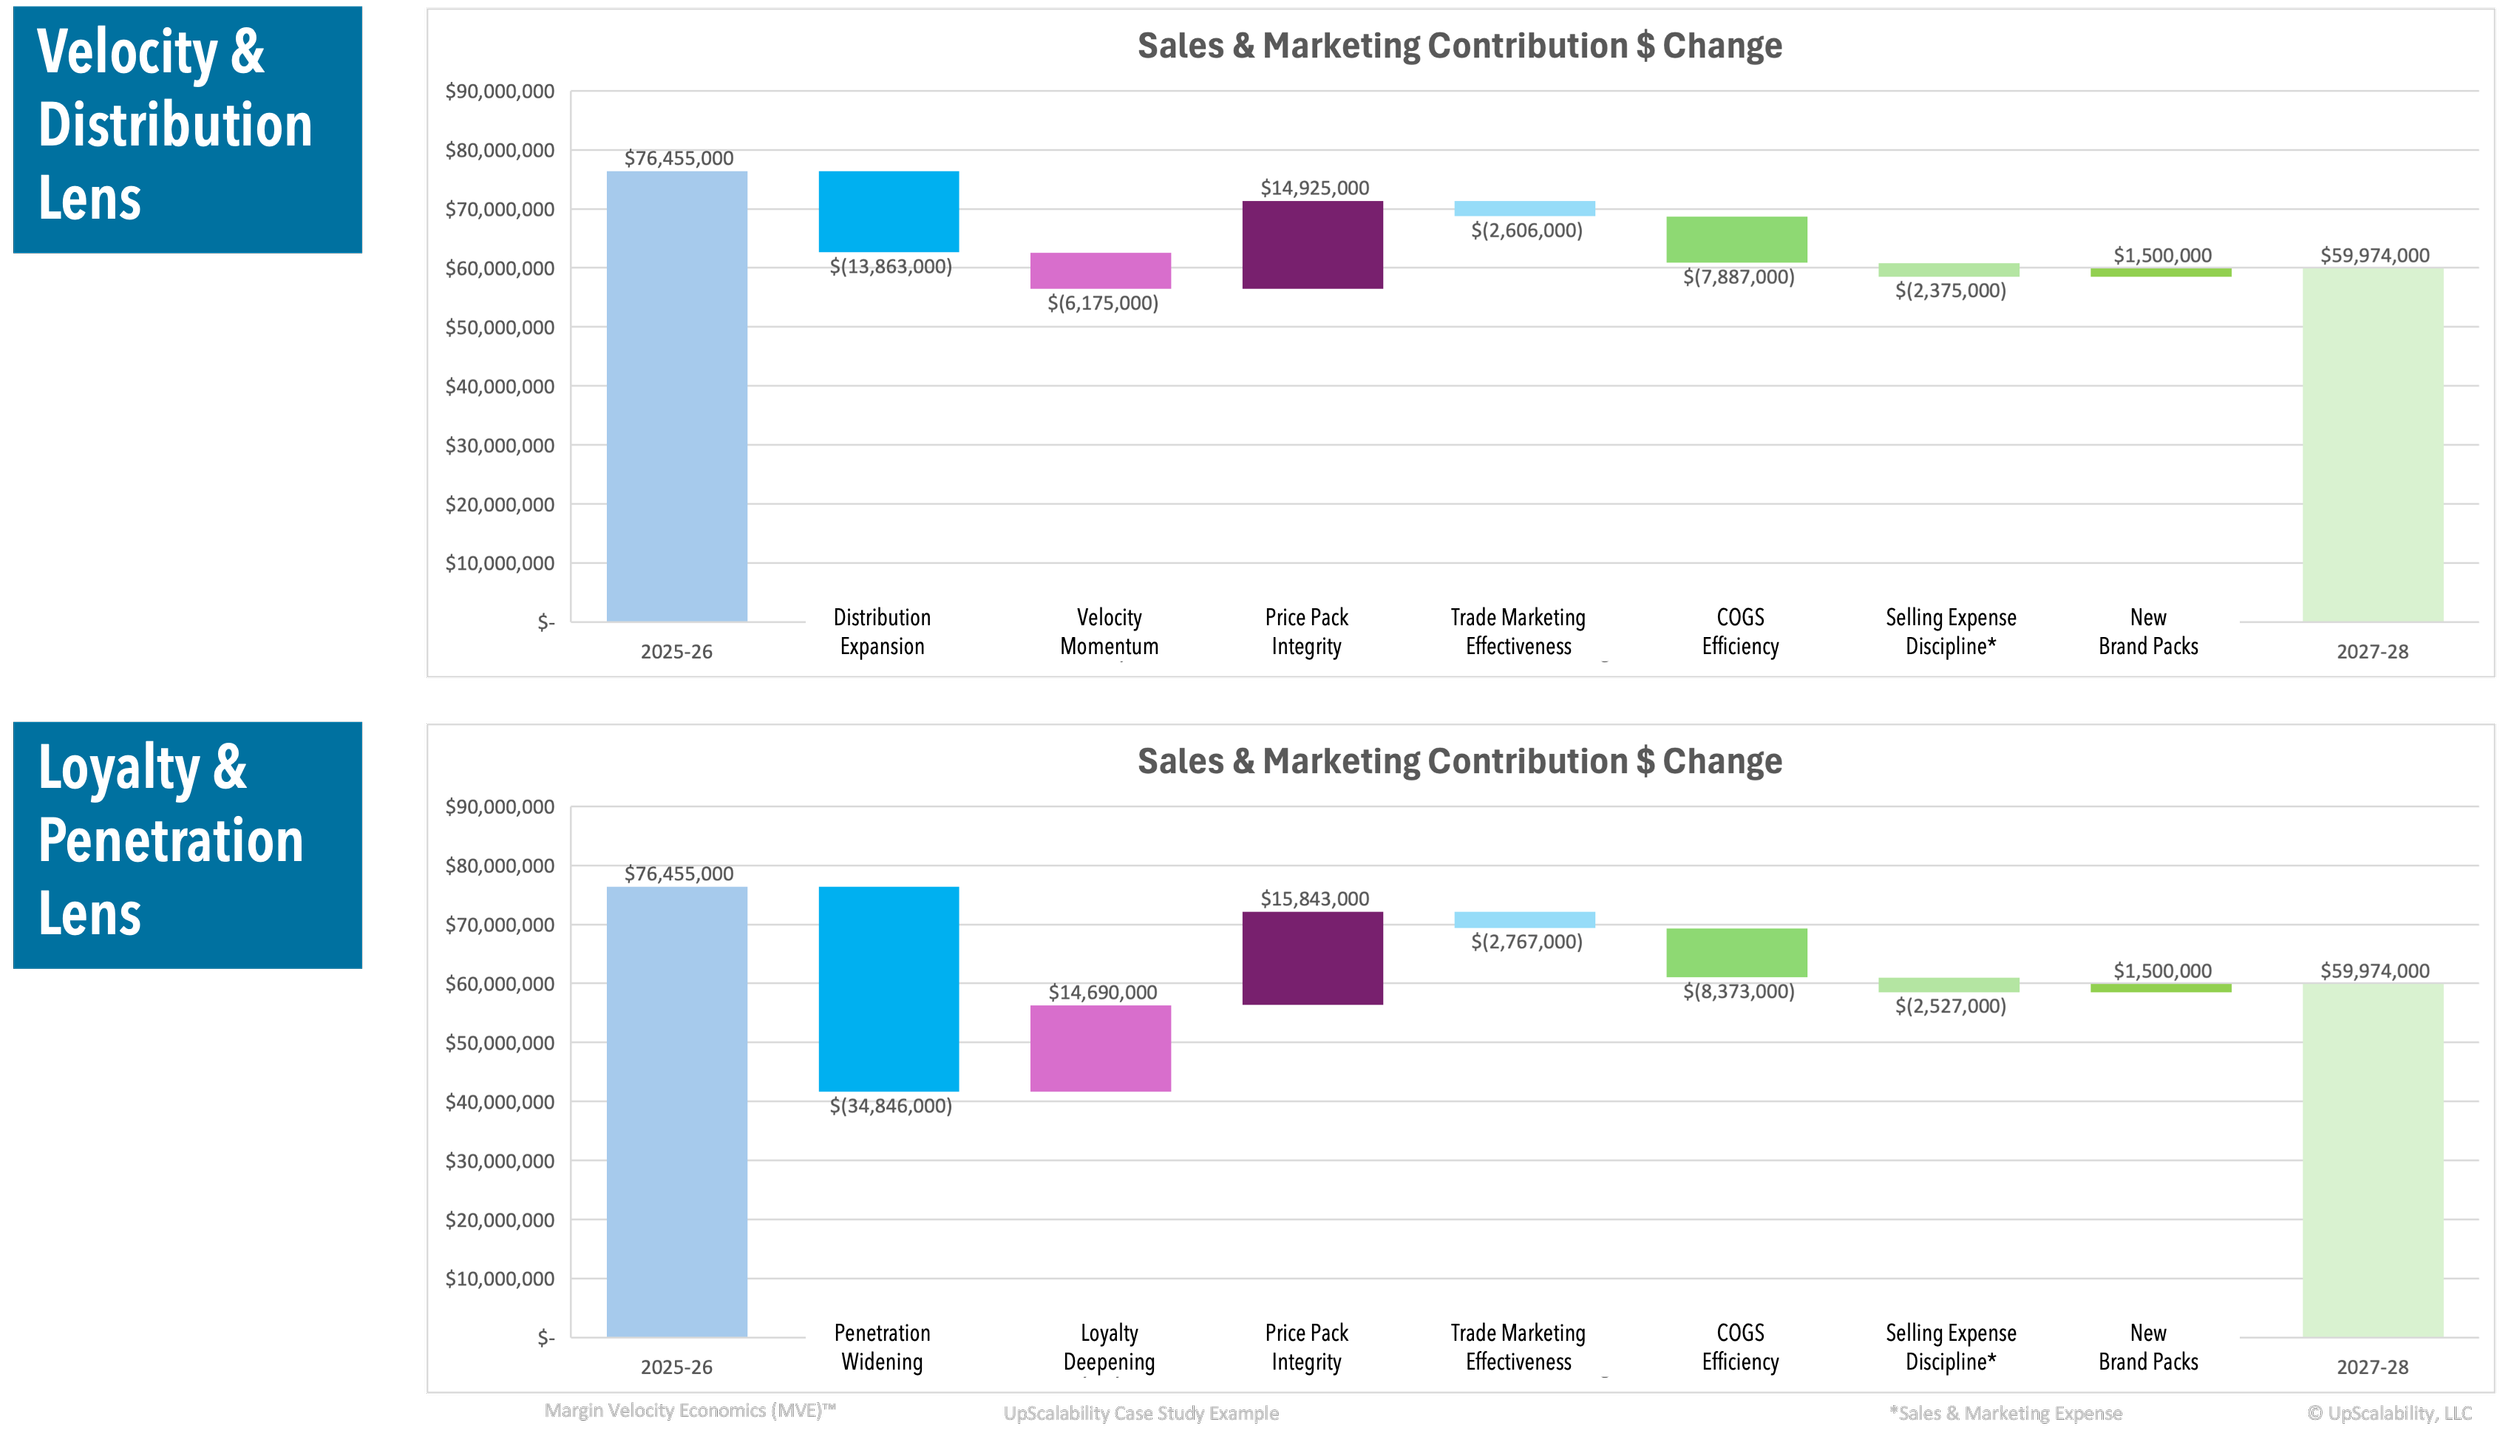
In the worked example above, the same brand's Sales and Marketing Contribution change between two periods is decomposed first through the Velocity–Distribution lens and then through the Loyalty–Penetration lens. The total change is the same in both views. The decomposition of how that change occurred is what differs — and which decomposition is most actionable depends on the commercial question.
The three diagnostic grids
The MVE breakdown of the financial impact of the six drivers allows brand or brand-pack performance to be mapped through three diagnostic grids. Each grid takes two of the variables that MVE quantifies and arranges them as a two-by-two view of structural commercial position.

The Unit Economics–Volume grid maps whether scale is earning its own economics or consuming them — whether the brand is in Powered Growth, Fragile Growth, or one of the deteriorating positions that follow when unit economics fail to keep up with volume.
The Velocity–Distribution grid maps whether velocity per door is earning the distribution being built — whether the brand is in Market Momentum, Spread Too Thin, or one of the related positions that follow when distribution outpaces the demand it requires.
The Loyalty–Penetration grid maps whether the brand is growing through new buyers, existing buyers, or both — whether the brand is in Penetration-Led Growth or Habitual Stickiness, Niche Devotion, Heavy Buyer Trap, or one of the related positions that follow when penetration and loyalty diverge.
The three grids are not separate diagnostic tools. They are three angles on the same underlying decomposition. A brand's position in one grid carries implications for its position in the others. Grid position is not an end in itself — it is the bridge between what the data is showing and what the commercial decision needs to be.
MVE is most often applied at the Sales and Marketing Contribution level, but the same logic extends up the P&L. The decomposition can be run at the revenue, gross profit, operating profit, or EBITDA level, depending on the question being asked and the data available.
The framework is particularly suited for brands in categories that use syndicated data providers like Circana, NielsenIQ, SPINS, or Numerator to track performance and explore competitive growth opportunities. MVE translates retail or B2B velocity, distribution, and pricing data into their direct financial impact on a brand's change in Sales and Marketing Contribution over a period or compared to a budget or target.
The power of MVE extends beyond historical diagnosis. The same decomposition that explains how a brand got from one period to the next can be run forward — to plan a pragmatic geographic or channel rollout, to map a competitive response, to stress-test a budget, or to pressure-test a new product or pack launch. The framework accommodates one-off market or category disruptions in a given period — a regulatory change, an inflation shock, a channel-specific event — by isolating the disruption's contribution impact rather than letting it contaminate the read on the underlying business.
Where MVE earns its place
I have evolved Margin Velocity Economics over the span of my corporate, entrepreneurial, and consulting career within the CPG industry. The methodology and approach is unique and proprietary to UpScalability, LLC.
The framework continues to develop. The Substack chapter "What Acquirers Are Actually Paying For in CPG M&A" and the companion essays that follow apply MVE to specific brand cases drawn from recent CPG M&A and from publicly traceable brand trajectories. The framework is the constant. The cases vary.
How MVE was developed
The strategic framework and commercial argument that this decomposition supports is at upscalability.com/mve
Two ways to explore how MVE can sharpen your brand's pricing and growth strategy:
A directional analysis — a focused diagnostic using available syndicated data for a defined set of brands or SKUs, retailers, and geographies. The goal is to surface the underlying drivers of recent contribution performance and identify where the most actionable insights sit.
A pilot engagement — a more comprehensive analysis covering your own and competitive brands across a targeted set of retailers and geographies. Outputs include the full six-driver decomposition, two-lens reads where the data supports it, and grid placement across the three MVE diagnostic grids — with commercial recommendations grounded in the framework's structural logic.